Topics:
- Be able to describe and sketch the domain of a function of two or more variables.
- Know how to evaluate a function of two or more variables.
- Be able to compute and sketch level curves & surfaces.
We’ve already see some multivariable functions without putting them in that context. For example:
A function of two variables is a rule that assigns a unique value to some set in . We call the domain of , and the range of is the set of outputs. We often write:
Similarly, in , A function of three variables is a rule that assigns a unique value to each point in some set . Here, we often write:
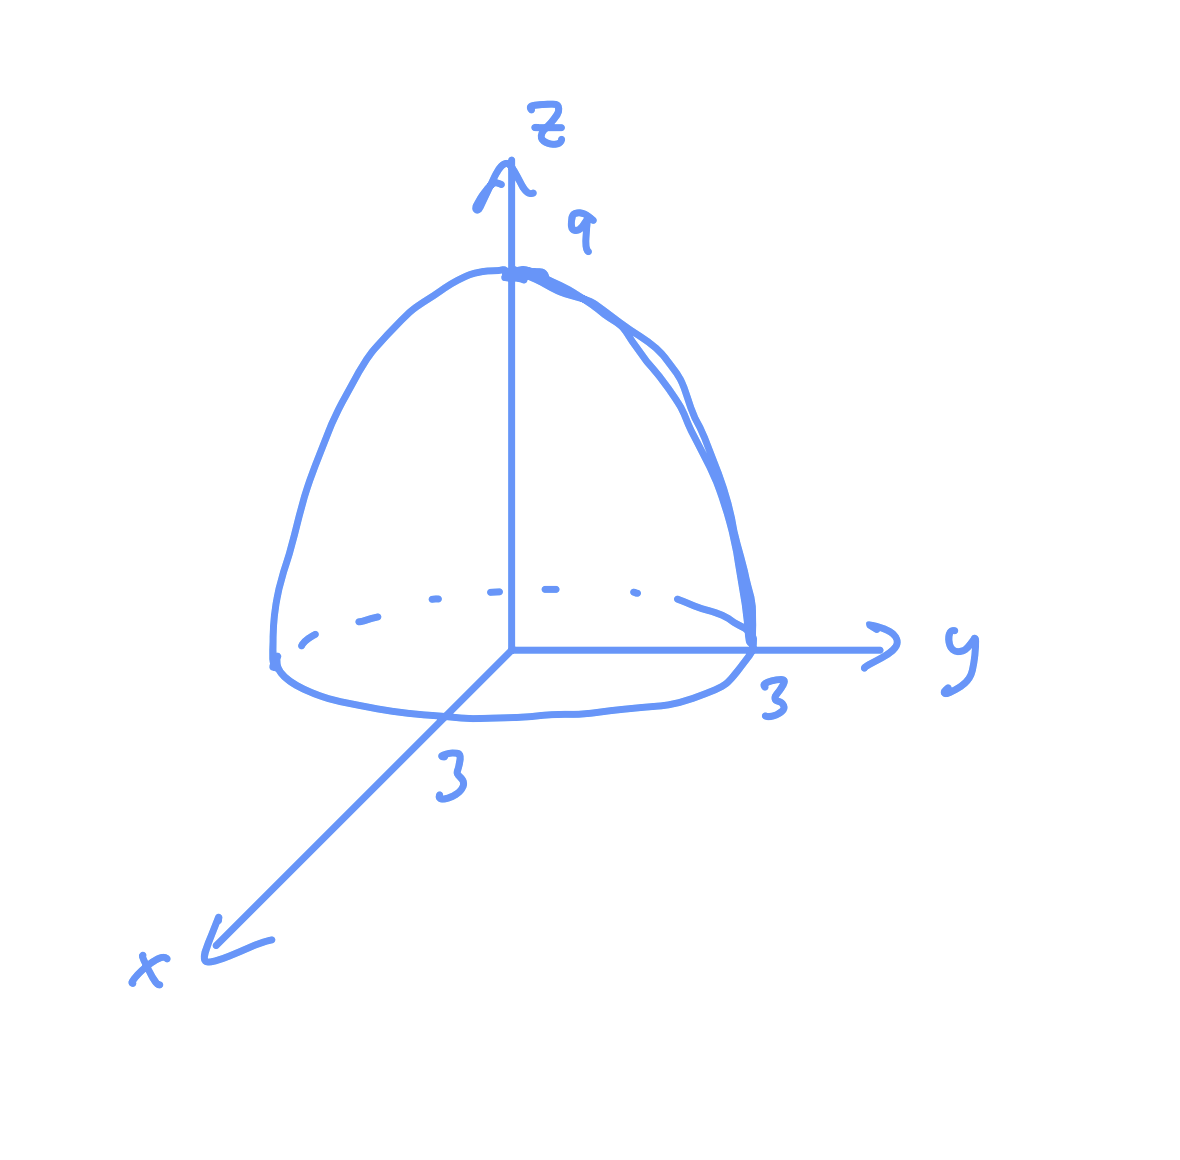
The graph of a function of two variables with domain is the set of all points such that and is in the domain of .
Another option and perhaps the only way to visualize a multivariable function is to consider points that correspond to the same output value. If we join points with the same output value (z → the same elevation) If we join points with the same output value we get level or contour curves.
talk. about contour plot